The heat map is a little-known and very useful tool in the blob and centroid finders. Many VMS users know it’s there, but few know what it does. It’s there to make life easier. Let’s explain. When you want to automatically detect or identify a feature, the blob finder works to do this by evaluating pixel intensities. It finds groups of like pixels and lumps them together into a blob. When necessary, the user can control the blob finder by setting manual thresholds for the pixel intensity.
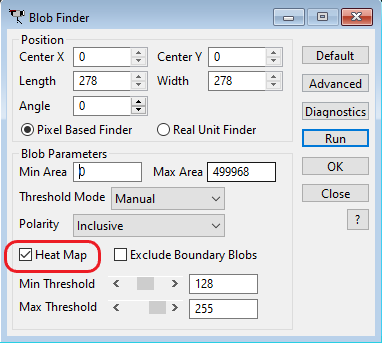
Unfortunately, finding the right manual thresholds can often be somewhat challenging. To help with this, the heat map makes adjusting manual thresholds much simpler by providing visual feedback on what the finder will detect. To engage the heat map simply activate it by clicking on its checkbox. Please note that heat maps are not available with automatic threshold modes or stored images. Heat maps require a live image to work.
In the blob finder, there are two different threshold modes: automatic and manual. In automatic mode the blob finder will seek “light on dark” or “dark on light” blobs that fit within the area thresholds. This can be good enough when the part is very simple and has clearly defined blobs with little noise in the image. In these cases, the heat map functionality is not really needed.
However, in cases where there is more noise in the video image, as shown below, the automatic mode has a chance of not detecting the desired blobs. It is essential then to select manual mode and narrow down manual threshold values so that the upper and lower thresholds fit into a window of acceptable values. The heat map helps with this by giving a visual representation of what blobs will be detected by shifting the live video image to a pseudo-color image that illustrates the manually chosen threshold values. When the heat map is active, the video window will illuminate the pixels that fall within the range selected in the manual threshold parameters.
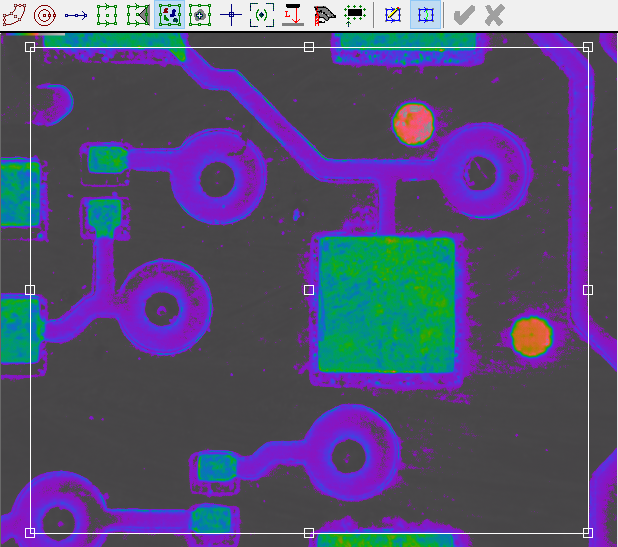
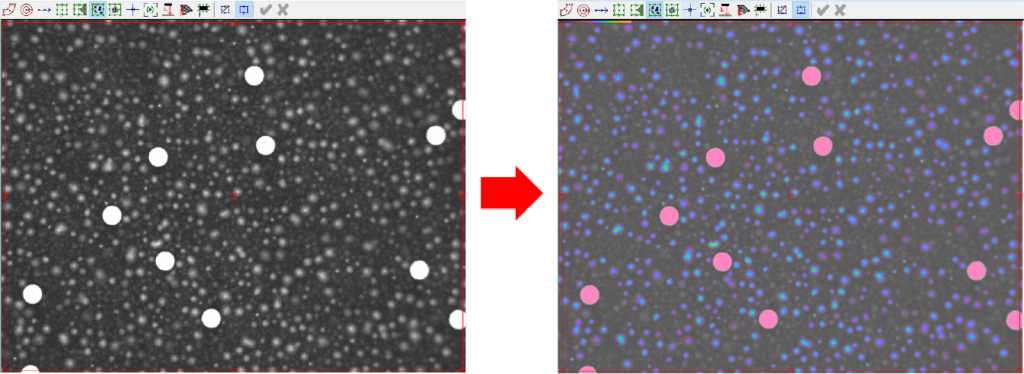
When inclusive polarity is selected, pixels within the minimum and maximum thresholds will be illuminated. The pixels will light up according to pixel intensity on a color gradient moving from violet to red as shown below.
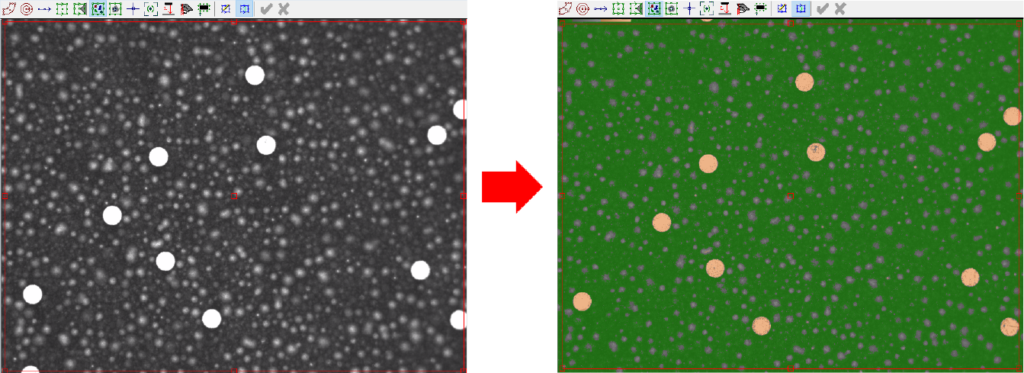
When exclusive polarity is selected, pixels outside the minimum and maximum will be illuminated. Any pixels with intensity below the minimum will be green, and anything above the maximum will be a peach color as shown below.
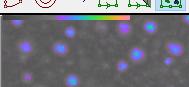
You may notice, when the heat map is enabled, a small bar appears in the upper left quadrant of the video window. This bar represents the intensity scale from 0-255 and will display an overview of which pixels in the image will be assigned what colors. The scale will show as gray where the pixel intensity falls outside the valid range given by the chosen threshold values.
The heat map works in a similar fashion with the centroid finder. By using the heat map the user will develop expert level ability in finding the right blob or centroid manual threshold parameters to fit the needs of the application. This will decrease the time spent programming and will likely improve the robustness of routines. See below for an example case where the heat map is used to identify desired blobs.
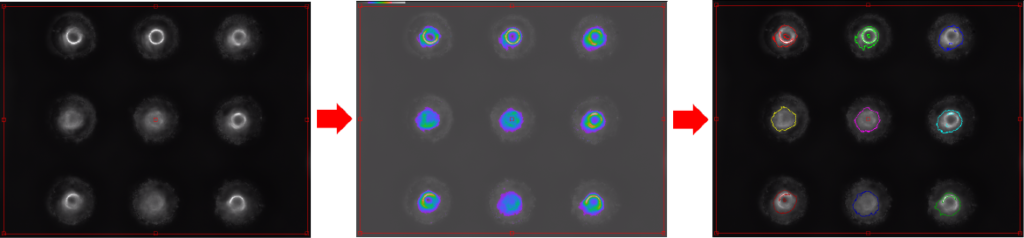
From left to right… Original image – Heat map active with chosen manual thresholds – Blobs found that match heat map results
In your future programming, be sure to turn up the heat with the heat map.